Every construction project starts with a plan. Milestones are defined, activities are placed on a timeline, dependencies are established and responsibilities are assigned.
Then the project starts.
A design package arrives late, a decision takes longer than expected or an unresolved issue blocks the next activity. Procurement moves, one milestone slips and eventually the project has a new plan. The schedule is updated to reflect the new reality.
But every update also makes it harder to see how the project moved away from the original plan.
The latest Gantt chart can tell you where the project is now.
It does not necessarily tell you how it got there.
For developers and project managers, that difference matters. When a project is six weeks behind schedule, the important question is rarely what the current programme says.
It is:
Where did the delay actually start?
A construction schedule is constantly changing
A Gantt chart is often treated primarily as a planning tool. At the beginning of a project, activities are mapped against time, dependencies show what needs to happen before something else can begin and milestones establish the key dates the team is working towards.
But a construction programme is not static. Dates move, activities are added, dependencies change, milestones shift and new information affects work that was already planned.
Updating the schedule is necessary. Every update, however, creates another version of what the team believes will happen.
If only the latest programme remains visible, part of the project history disappears. The team can see today's plan, but it becomes much harder to see when reality first started moving away from the original one.
The problem is not knowing that the project is late
By the time a major milestone has moved, everybody usually knows there is a delay. The harder part is understanding what caused it.
Was the activity itself late, or was it waiting for something else? Which unresolved issue affected it? Did a design change create the delay? Was a decision made too late? Was the original programme unrealistic?
And perhaps most importantly:
When could we first have known that the milestone was at risk?
Answering these questions requires more than a Gantt chart. It requires the schedule to remain connected to what was actually happening in the project.
How to make a project schedule traceable
Build the project plan in a Gantt chart
The starting point is still the programme.
A Gantt chart gives the team a visual overview of project activities across time, including start and end dates, duration, milestones, responsibilities, progress and dependencies between activities. For an active project, this creates a shared view of what should happen and when.
But the value of a digital project programme should go further than visualising activities on a timeline. Those activities need to become part of the project's wider information structure, because a task rarely exists in isolation.
Connect activities through dependencies
Consider a simplified sequence:
Design approval Technical design Procurement Installation
If design approval moves by two weeks, the impact may continue through every activity that depends on it. Dependencies make those relationships visible.
This allows the project team to understand that a delayed activity is not simply an isolated late task in a Gantt chart. It may be the beginning of a chain that affects several later activities.
That becomes especially important in complex development projects where dozens of activities depend on information, decisions or work produced elsewhere in the project.
Instead of looking only at which activity is late, the team can also understand what else that activity affects.
Connect issues to the work they affect
Schedules tell us what was supposed to happen. Issues help explain what happened along the way.
Imagine that a technical design package was due on 10 March. During coordination, an unresolved issue appears and prevents the design from being approved. Approval moves, procurement cannot begin and the procurement milestone moves as well.
If the issue exists in one system and the programme in another, reconstructing that sequence later requires somebody to know that the two were related.
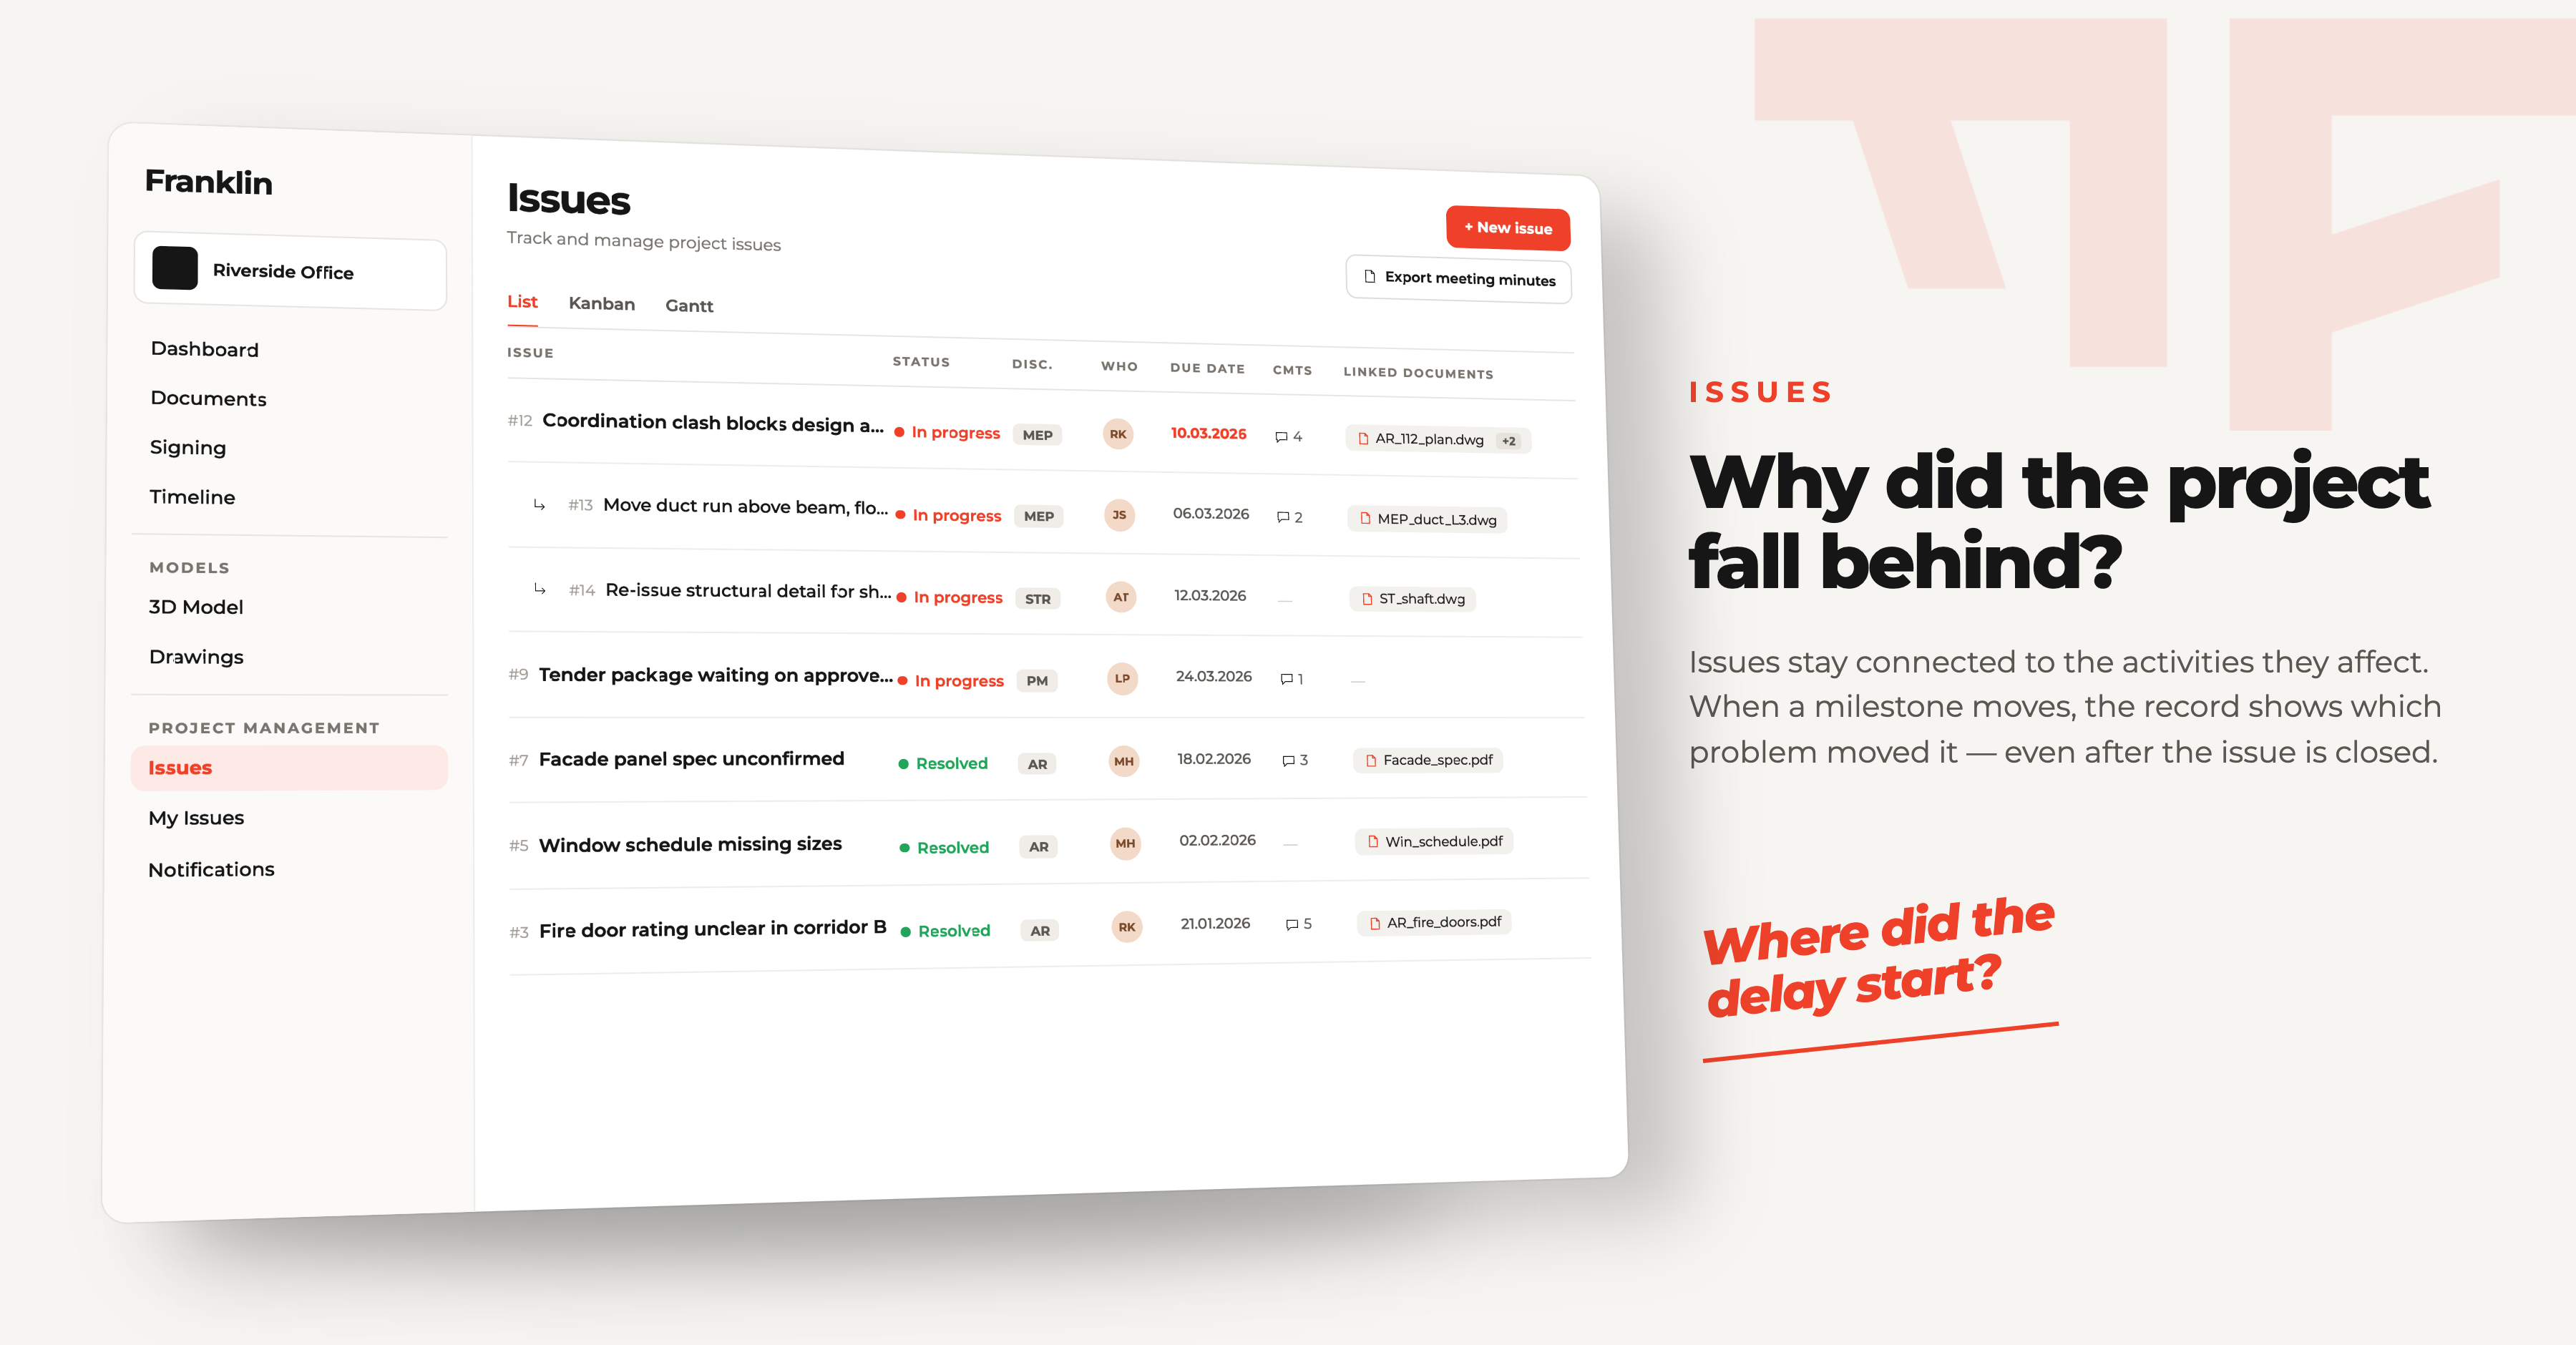
When issues and project activities are connected, that relationship becomes part of the project record. The team can see that an activity did not simply move — there was something connected to it.
The issue itself also remains traceable: when it was created, who was responsible, how its status changed, when it was resolved and which part of the project it affected.
This turns issue tracking from a list of open and closed items into part of the explanation of how the project developed.
Keep previous versions of the schedule
This is where construction schedule tracking becomes much more useful.
A programme from January represents what the team believed would happen in January. A programme from April represents what they believed three months later. The final programme represents what eventually happened.
Those are not redundant versions. They are evidence of how the project evolved.
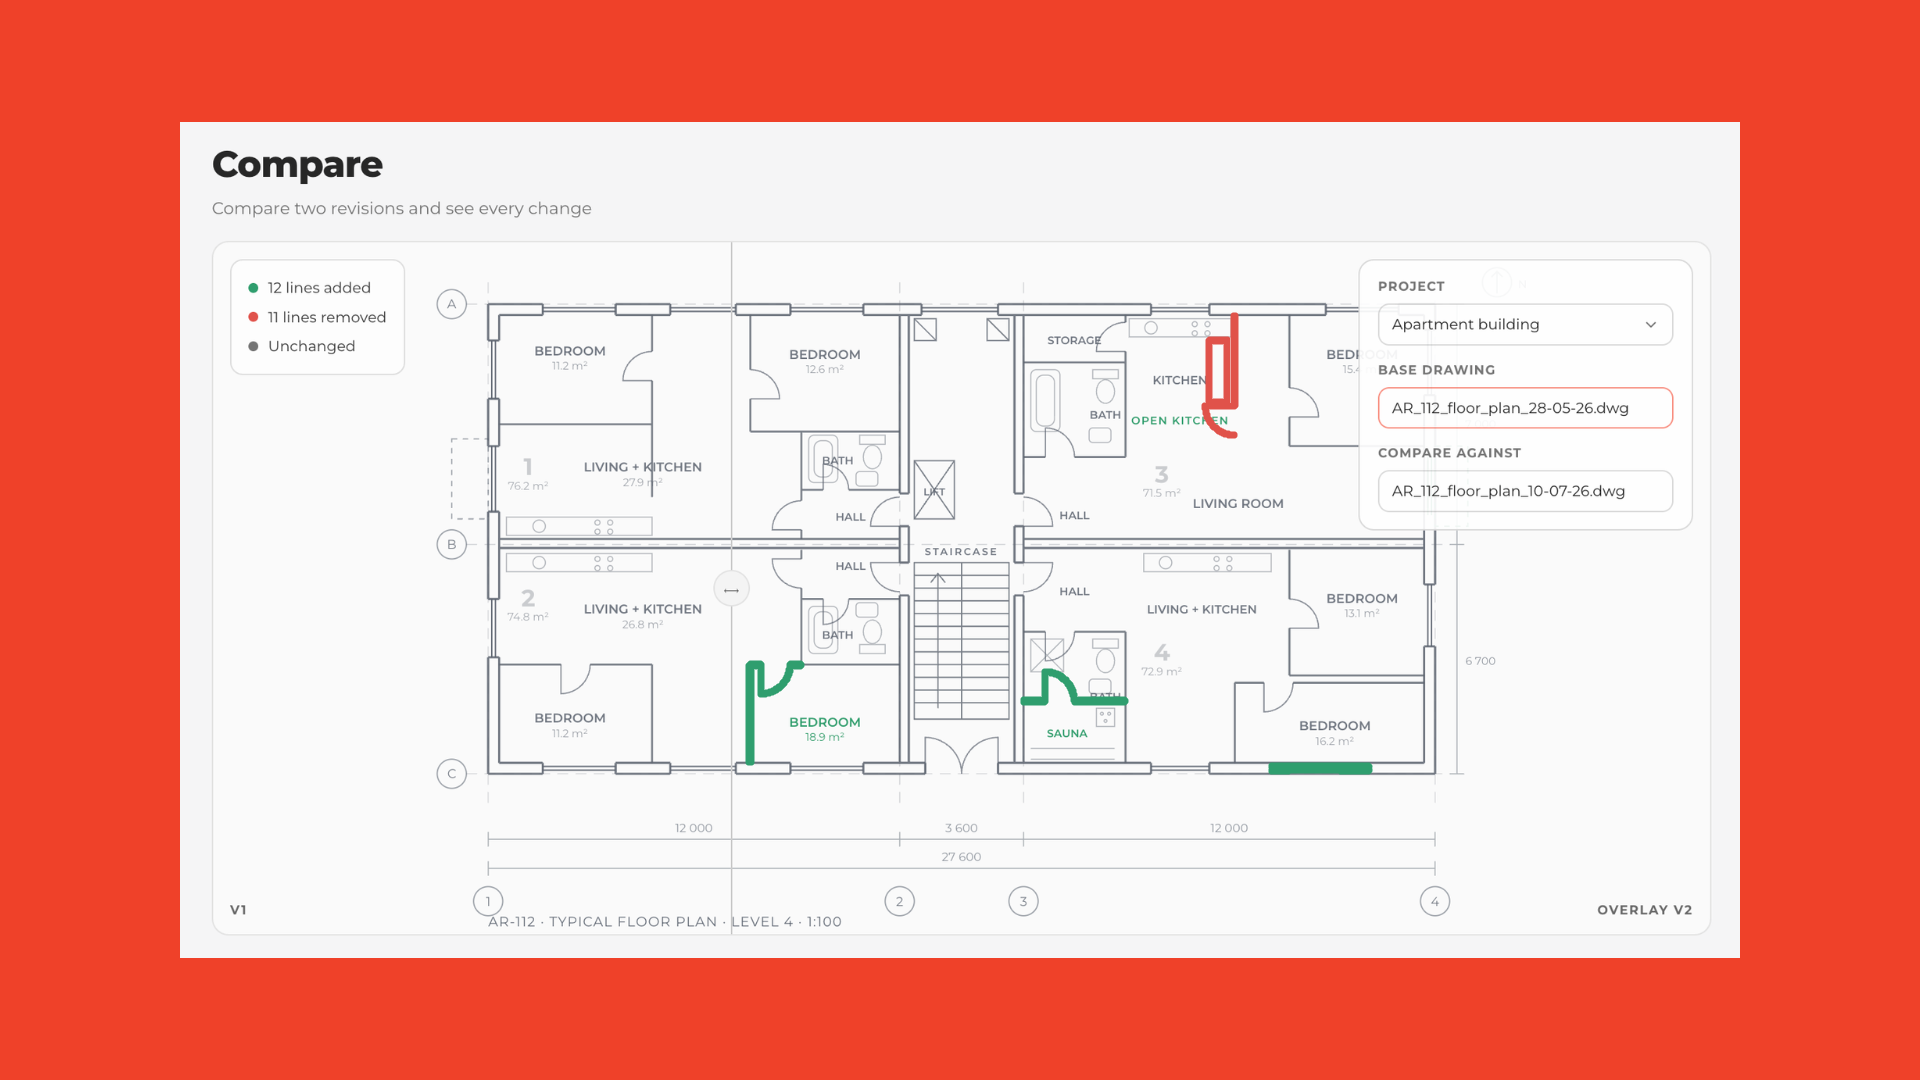
Keeping previous versions of a Gantt chart makes it possible to compare the original baseline with later updates, forecasts and eventually the actual outcome. Instead of seeing only that a milestone moved by six weeks, the team can see when that movement first entered the programme.
Perhaps the first two-week shift appeared in February. Another dependency moved in March. By May, the six-week delay was already unavoidable.
That history is extremely difficult to reconstruct if every programme update simply overwrites the previous one.
Keep issues traceable after they are resolved
A closed issue is still project information.
During an active project, teams naturally focus on what remains open. Once an issue has been solved, it disappears from attention. But months later, that same issue may explain why an activity moved, why a technical solution changed or why procurement started three weeks later than originally planned.
This is why project issue tracking should preserve history rather than treating “closed” as “no longer relevant.”
The issue may be finished. Its role in the project history is not.
Connect the schedule to what actually happened
A project timeline and a project schedule answer different questions.
The Gantt chart shows what should happen when. The project timeline shows what actually happened over time.
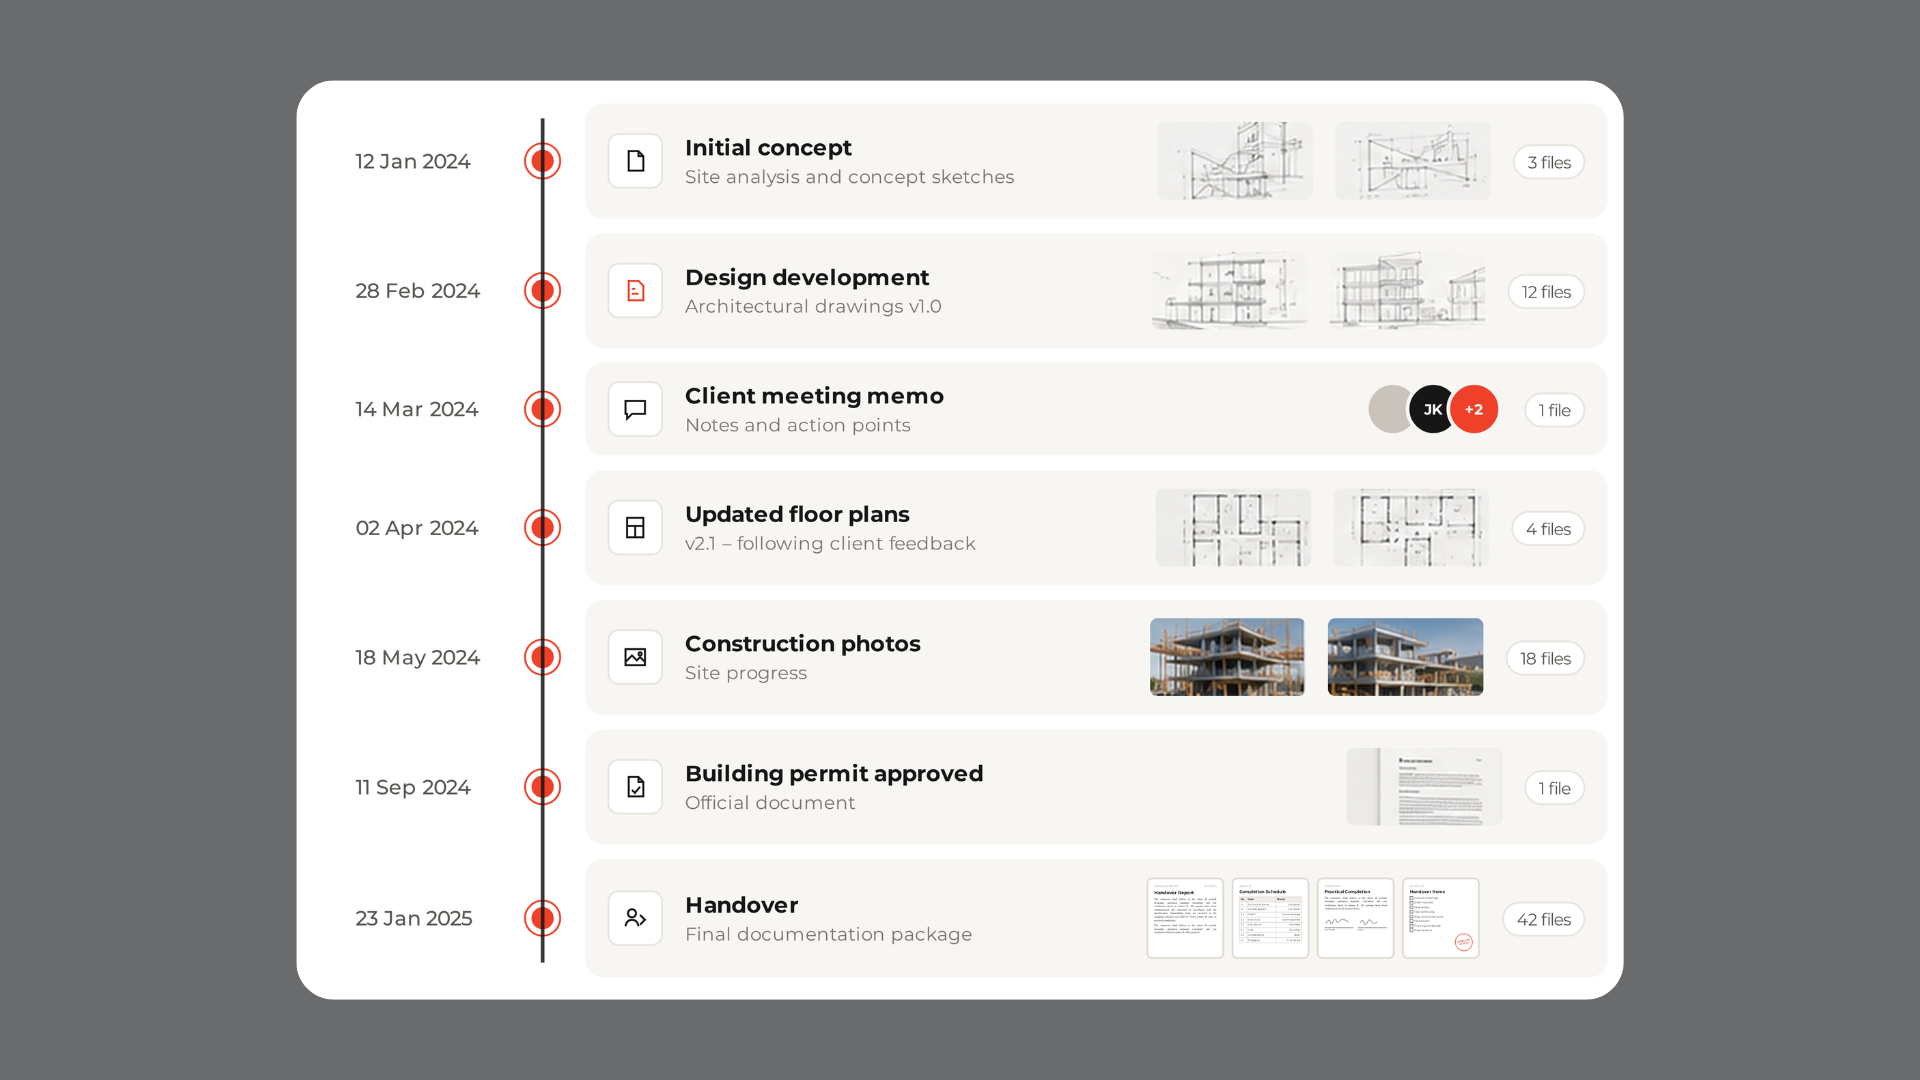
A drawing was updated, an issue was created, a document changed, a decision was made, an issue was resolved or a milestone moved. Individually, these are small events. Together, they tell the story of the project.
This is where project management becomes more than task management. Instead of maintaining separate records of schedules, documents, issues and changes, the project begins to develop a traceable history.
Compare the plan with the actual outcome
At the end of a project, the final Gantt chart tells only part of the story. The more useful comparison is between what the team originally expected and what actually happened.
For example:
| Original plan | Actual outcome |
|---|---|
| Design approval — 10 March | Approved 24 March |
| Procurement start — 15 March | Started 1 April |
| Installation start — 15 May | Started 3 June |
But dates alone still do not explain the project.
If design approval moved because of an unresolved coordination issue, procurement depended on that approval and installation depended on procurement, the team can see the chain of events behind the final delay.
The project has not simply recorded that something was late. It has preserved context around why the outcome differed from the plan.
From reporting delays to understanding them
Traditional project reporting is very good at describing the current state: the project is four weeks late, a milestone has moved, these issues remain open or these activities are currently critical.
All of that matters.
But another layer of project management becomes possible when schedules, dependencies, issues, documents and project history remain connected.
You can start asking why.
Where did the delay begin? Which issues affected this milestone? Which activities moved most compared with the original programme? When did the completion date first start slipping? What happened before this activity was delayed?
Today, answering questions like these often means reconstructing the project manually from schedules, meeting minutes, emails, issue lists and people's memories.
The information often exists.
What is missing are the connections between it.
Why this matters across a real estate portfolio
For a developer managing one project, this creates better project visibility. For an organisation developing many buildings, it can create something more valuable: a consistent history of how projects actually perform.
One project may repeatedly lose time during design coordination. Another may struggle around decisions and approvals. Another may have a pattern of procurement-related delays.
If every completed project ends as a collection of final documents and a final programme, much of that knowledge disappears. If the relationships between the plan, issues, changes and outcome remain traceable, completed projects can become useful information for future ones.
The question is no longer only:
Did this project finish on time?
It becomes:
What can this project tell us about how our projects actually work?
Project management should create project memory
Franklin's project management workspace is being built around this idea.
The Gantt chart provides the plan. Dependencies show how activities affect one another. Issues capture problems that arise during the project. Project history preserves what changed over time.
Together, they create something more useful than another task list: a traceable record of the project.
During the project, that helps the team understand what is happening. Afterwards, it helps them understand why it happened.
And as more project information becomes connected, the interesting question for AI is no longer simply:
“Show me the schedule.”
It becomes:
Why is the project six weeks behind?
Frequently Asked Questions
A Gantt chart is a visual project schedule that shows activities against time. It can include start and end dates, durations, milestones, responsibilities, progress and dependencies between activities.
Dependencies describe relationships between project activities. They show when one activity relies on another being started or completed before work can continue. Tracking dependencies helps teams understand how a delay in one part of the project may affect later activities.
Tracking delays requires more than comparing planned and actual completion dates. Teams can preserve schedule versions and connect changes in activities and milestones with relevant issues and project events. This makes it easier to understand when a delay first appeared and what contributed to it.
Previous schedule versions show how the project plan changed over time. Comparing an original baseline with later forecasts and actual dates can help teams identify when activities or milestones began to slip rather than seeing only the final outcome.
A resolved issue may still explain later project outcomes. Keeping closed issues connected to project history makes it possible to understand why an activity, design solution or milestone changed even months or years later.
A Gantt chart primarily represents what is planned to happen and when. A project timeline records events that occurred throughout the project, such as document updates, issues and changes. Used together, they provide both the plan and the history of what actually happened.
AI can help analyse connected project information and identify relationships between schedules, issues, documents and historical events. The quality of that analysis depends on the underlying project information being structured, connected and traceable. Conclusions about technical causes, responsibility or contractual liability still require professional validation.